A Shopify weekly action plan is a short, ranked list of 3–5 specific actions a merchant should take during the next seven days, generated from current store data. It replaces open-ended dashboards with concrete decisions: restock SKU-A by Friday, send a win-back email to 218 lapsed customers, raise the price on SKU-B by 12%. Done well, a weekly action plan compresses hours of analytics scrolling into a fifteen-minute review and three calendar entries.
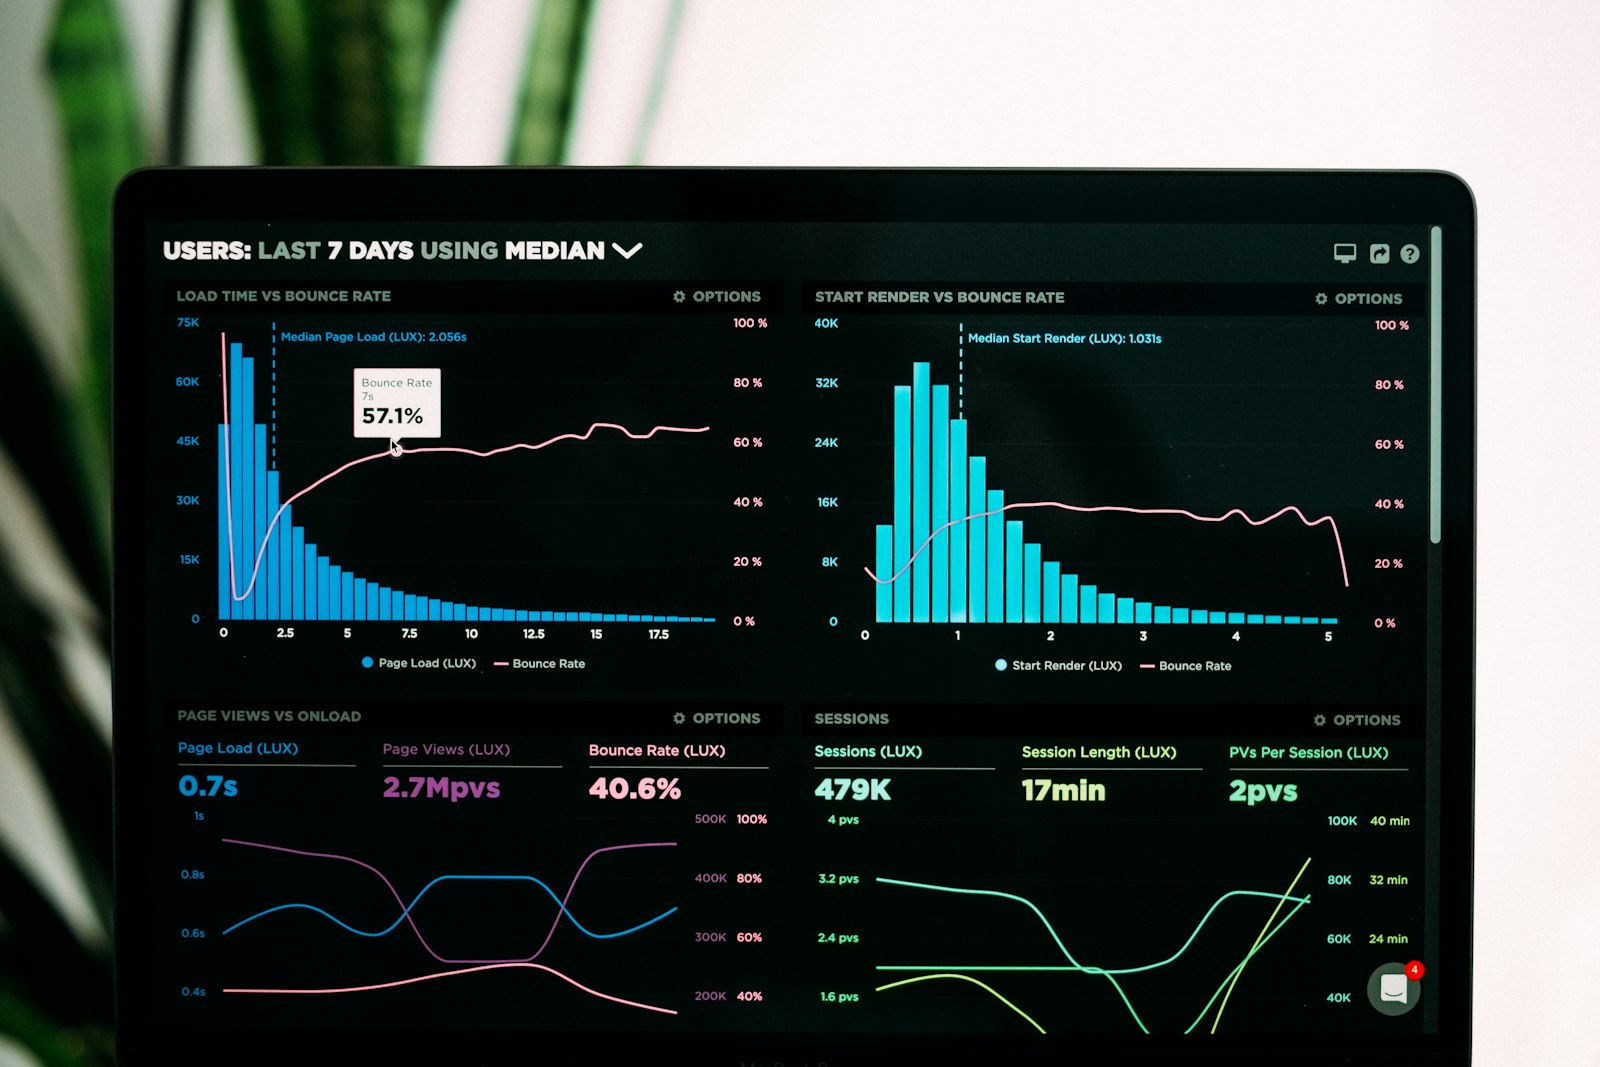
Most Shopify merchants drown in dashboards. There are charts for revenue, conversion rate, sessions, AOV, repeat rate, refunds, ad spend, ROAS, traffic source, device, country, and time of day — and a small business owner is supposed to look at them all, every week, and somehow turn them into the right next step. The weekly action plan flips that workflow on its head: instead of "here's the data, you figure out what to do," it answers "what should I do this week?" up front, and only shows the data needed to justify each recommendation. This article walks through what a weekly action plan looks like, the framework for building one yourself, the trade-offs you'll hit, and how DropifyXL automates the whole loop.
Why Shopify dashboards fail solo merchants
Shopify's built-in analytics page is excellent for one job: showing you how the store performed historically. It is poor at the next job — telling you what to change. The gap is structural, not a UI flaw.
A dashboard answers descriptive questions: how many sales did we make yesterday, what was our conversion rate, who was the top-selling product. A merchant running a 1–3 person operation needs prescriptive answers: which product to restock, which customer segment to email, which product page to fix first. Translating descriptive into prescriptive is hard, and it is the single biggest time sink for solo and small-team Shopify merchants. Studies of small-business owners consistently find that operators spend more time looking at numbers than acting on them — and the conversion rate from "looking" to "acting" is brutal.
There are three specific failure modes:
- The chart-dump problem. Modern analytics tools optimize for completeness — show every metric, every cut, every filter. For a solo merchant, that's noise. The signal-to-decision ratio collapses.
- The "what changed?" problem. A line going down on a chart isn't an action. It's a question. Turning it into an action requires connecting "revenue dipped" to "your bestseller went out of stock on Tuesday" — which dashboards rarely surface automatically.
- The decision-fatigue problem. Even when the data is clear, deciding which of fifteen possible actions to take this week consumes more cognitive energy than just doing the action would. The plan removes the meta-decision.
A weekly action plan addresses all three by doing the descriptive→prescriptive translation up front, ranked, capped at five items.
What a weekly action plan looks like
A useful plan has a fixed shape:
- 3 to 5 items. Fewer than three feels under-baked; more than five gets ignored. Five is roughly the working-memory ceiling for "things I owe myself this week."
- Each item has a deadline. "Restock SKU-A" without "by Friday" decays into a permanent open tab.
- Each item has a number. "Sales are down" is not actionable; "your bestseller has 4 days of inventory left at current sell rate" is.
- Each item has a one-click action. Friction kills compliance. The plan should link directly to the screen where the action is performed (the product editor, the customer segment, the email composer).
- Items are ranked by impact, not chronology. The first item is the one you should do today, not the one that arrived first.
A real plan from a Shopify dropshipping store might look like this:
| # | Action | Why now | Deadline |
|---|---|---|---|
| 1 | Restock "Linen Throw — Sand" | 3.4 days of cover at current sell rate; this SKU is 19% of last-30d revenue | Mon |
| 2 | Send win-back email to 218 customers past their reorder cadence | Avg gap is 41 days, these are at 67+ | Wed |
| 3 | Raise price on "Ceramic Vase — Small" by 8% | Margin is 22% and competitor median is +14% above us | Fri |
| 4 | Add "Linen Throw" to homepage collection | Top-3 by units sold last 30d, currently not on homepage | Fri |
| 5 | Audit checkout for mobile users | 71% of sessions, 58% of conversions — gap suggests a friction point | Next week |
Five items, each one a decision that costs the merchant somewhere between five and forty minutes to execute. The descriptive math is in the "Why now" column; the action is in the "Action" column; the ranking is in the order. That's the entire artifact.
The framework: how to build one yourself
If you don't want to use a tool, here's the framework. It's a five-question loop you run every Monday morning.
Question 1: Are any of my best sellers about to stock out?
Pull last-30-day units sold per SKU. Sort descending. Take the top 20% of SKUs by velocity. For each, calculate days_of_cover = inventory_on_hand / (units_sold_last_30d / 30). Anything under 7 days is an action. Anything under 14 days is a watch.
The cost of getting this wrong is asymmetric: stocking out of a top-20% SKU for a week typically costs 2–6% of monthly revenue, while over-ordering ties up cash you could deploy elsewhere. Lean toward earlier reorder.
Question 2: Are there customers past their reorder cadence?
For repeat-purchase categories (consumables, fashion, supplements), every customer has an implicit reorder rhythm. Calculate avg_order_gap_days per customer (mean gap between consecutive orders). A customer at 1.5 × avg_order_gap_days past their last order is "lapsing." A customer at 2.5 × is effectively gone unless you reach out.
The action is a win-back email — see the win-back guide for sequence and discount strategy.
Question 3: Are there pricing mismatches with my margin and competition?
Pull margin per SKU ((price - cost) / price). Anything under your portfolio's median by more than 10% is a candidate to raise. Anything where your price is 15%+ below the category median, on a high-velocity SKU, is leaving money on the table.
A modest 5–10% price test on a strong SKU rarely tanks volume but materially lifts margin dollars. The risk is reversible — you can put the price back if conversion drops.
Question 4: Are my best products actually being merchandised?
Cross-reference top-sellers (by 30-day units) with your homepage and main collection. Anything in the top 10 that isn't visible from the homepage in two clicks is wasted velocity. Move it forward.
This is the single highest-ROI hour you'll spend on the storefront most weeks: the inventory and the demand are already aligned, you're just removing friction.
Question 5: Where is my funnel leaking the most?
Compare device-level conversion rate (mobile vs desktop), ad-channel ROAS (Meta vs Google vs TikTok if you run paid), and PDP-level conversion (sessions vs add-to-carts on top products). The widest gap relative to your baseline is the next leak to plug.
This question is harder to answer without a Web Pixel — Shopify's built-in analytics expose some of it, but you need behavioral events for the granular cuts. DropifyXL's Plus plan ingests these events automatically.
The ranking math
The hard part of the framework is question six: when you have eight candidate actions, which five do you keep?
The principled answer is expected revenue impact divided by execution effort. A useful informal scoring:
- Impact score (0–10): how many dollars does this move? A stockout averted on a top-3 SKU is a 9. Adding a top-10 product to the homepage is a 6. Tweaking the footer copy is a 1.
- Confidence score (0–10): how sure are you the data is real? Stockout math from real inventory + real velocity is a 9. A "feels low" pricing intuition is a 4.
- Effort score (0–10): how long will it take? Sending a templated email is a 2. Rebuilding a PDP is an 8.
priority = (impact × confidence) / effort
Plot all candidates by priority. Take the top five. The math is rough; the discipline of doing it forces honesty about which actions are actually worth the week.
A worked example: a hypothetical $30K/month dropship store
Imagine a Shopify store doing $30K/month, 300 orders, average order $100, 22% margin. Mostly home-goods dropshipping, average reorder cadence is 60 days for repeat customers. The merchant runs paid traffic on Meta and TikTok, no Google.
Monday morning, they run the framework. Here's what they find:
- Q1 — Restock: Two SKUs (linen throw, ceramic vase) in the top 10 are at 4 and 6 days of cover. Top SKU is the linen throw — 19% of last-30d revenue. Triggered.
- Q2 — Win-back: 218 customers are past their reorder cadence. Most are 90+ days in (last reorder gap was 60 days; they're at 150+). Triggered.
- Q3 — Pricing: No major mismatches. Two SKUs are slightly under category median but margins are healthy. Skip.
- Q4 — Merchandising: The linen throw is on the homepage but the matching cushion (a top-15 SKU) isn't. Quick win.
- Q5 — Funnel: Mobile conversion is 1.4%, desktop is 3.1%. That gap is wider than the merchant's category benchmark of ~1.6×. Triggered, but execution is high-effort (PDP audit, theme work).
Scoring with the formula: restock comes in highest (impact 9 × confidence 9 / effort 2 = 40.5). Win-back is next (impact 7 × confidence 8 / effort 3 = 18.7). Mobile audit scores high on impact (8) but execution is heavy (effort 8) — it ranks below cushion-merchandising (impact 5 × confidence 8 / effort 2 = 20). Pricing is skipped.
Final plan, ranked: restock, win-back, merchandise the cushion, mobile audit, plus one slot left over for whatever the merchant prioritizes ad-hoc. Five items. Ten minutes to identify, four hours to execute over the week.
The merchant doesn't open a single dashboard the rest of the week. They check items off as they go.
How DropifyXL automates this
The framework above is solid — and it takes 30–60 minutes every Monday once you're fluent. DropifyXL runs the same five-question loop automatically against your Shopify data, every week, and delivers the ranked plan directly inside your Shopify admin and as a Monday-morning email.
Specifically:
- Sync. On install, DropifyXL pulls your last 90 days of orders, your full catalog, customers, and (on the Plus plan) anonymized visitor analytics. Data refreshes via Shopify webhooks so the plan is always current.
- Rules engine. Six deterministic rules cover the questions above: restock, win-back, pricing, hidden-hero (merchandising), abandoned cart, and ad-creative briefs. Plus four behavioral rules on the Plus plan that need pixel data: PDP conversion, ad-channel leak, time-of-day, mobile bounce.
- LLM polish. Each recommendation's language is rewritten by a large language model to sound friendly and specific. The numbers, product names, and IDs come from the rule, not the LLM — so there's no risk of hallucinated SKUs.
- Delivery. Plan appears in the Shopify admin (free plan: 1 recommendation; paid: up to 5). Paid plans also get a weekly email digest, with a daily digest on Plus.
- One-click actions. Each recommendation links straight into the relevant Shopify admin screen — restock recs deep-link to the product editor, win-back recs to the customer segment, pricing recs to the price field.
The tool isn't magic; it's the framework above, automated, with rules tuned by hundreds of hours of merchant interviews. The merchant time savings is the point: ten minutes a week reviewing the plan instead of an hour scrolling charts.
Common mistakes when running a weekly plan
Even with a clean framework, merchants trip on the same handful of failure modes:
- Doing too much. Five items is the cap. Six is too many. The cost of a sixth action is not the action itself — it's the dilution of attention on the first five.
- Skipping easy wins for hard ones. A merchant will spend three weeks rebuilding a PDP (impact 8, effort 8) while ignoring the homepage merchandising fix (impact 5, effort 2). The latter ships dollars sooner.
- Treating the plan as obligation rather than information. If three of five recommendations don't make sense for your business this week — skip them. The plan is a draft. The merchant has the final call.
- Not tracking completion. If you don't know which recommendations you acted on last quarter, you can't tell which ones moved the needle. DropifyXL's done/snoozed/dismissed states write to an audit log specifically to enable this.
- Confusing scanning with planning. Reading the dashboard isn't the same as deciding. The plan exists to force a decision.
Frequently asked questions
How long should a weekly action plan take to review?
Ten to fifteen minutes for the review itself. Two to four hours over the rest of the week to execute. If the review is taking longer than fifteen minutes, the plan has too many items or too much narrative — trim it.
Is weekly the right cadence, or should it be daily / monthly?
Weekly works for stores doing roughly $5K–$500K/month. Below that, the data refreshes too slowly to justify a weekly review (consider biweekly). Above $500K/month, you may want a daily plan for the most volatile categories (inventory, paid spend) and a weekly one for slower-moving decisions. DropifyXL's Plus plan delivers a daily plan; Pro is weekly.
What if the plan tells me to do something I disagree with?
Skip it. The plan is informational, not prescriptive. If a recommendation reads as wrong, dismiss it — and ideally flag the dismissal so the rules engine learns to deprioritize that pattern for your store. DropifyXL's "Dismissed" state does exactly this.
Can I just look at Shopify's built-in reports?
You can. The built-in reports are excellent for descriptive analysis. You'll just have to do the descriptive→prescriptive translation yourself, every week, every metric. That's the time cost the action plan is designed to remove.
How is this different from a generic to-do list?
A to-do list is a place to write things down. A weekly action plan is a place to decide what to write down — backed by store data, ranked by expected impact, capped at five items. The to-do list is the output; the plan is the upstream decision process.
Does the plan replace strategic thinking?
No. The plan handles the recurring tactical decisions — what to restock, who to email, what to merchandise. Strategic decisions (which channels to invest in, what categories to expand, when to launch a new product) still need a human. The plan frees up the time to think about them.
Key takeaways
- A Shopify weekly action plan is a ranked list of 3–5 specific actions a merchant should take during the next seven days, with a deadline and a number for each.
- Dashboards fail because they're descriptive ("what happened") and merchants need prescriptive ("what should I do"). The plan handles the translation.
- The five-question loop — restock, win-back, pricing, merchandising, funnel-leak — covers most of the high-ROI weekly decisions for a Shopify store.
- Rank candidates by
(impact × confidence) / effort. Take the top five. Skip the rest. - A tool like DropifyXL automates the loop entirely, running the rules every week and delivering the plan in your Shopify admin and inbox.
- The merchant time savings — from an hour of scrolling to ten minutes of review — is the entire point.
The next week to look at is the one in front of you. Pick five things. Do them. See you next Monday.

